Additional References
March 2005, The Elliott Wave Theorist
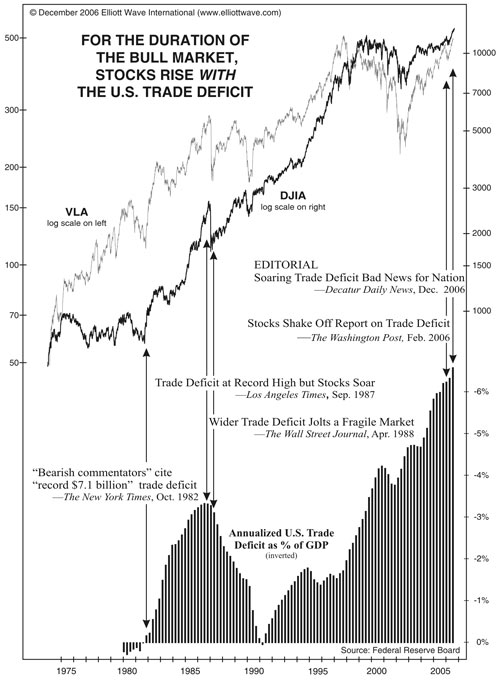
Economists assign a bearish value to the widening trade deficit. An article on January 23 accurately stated, “After the November report of a record trade deficit was released, economists rapidly reduced their forecasts of fourth-quarter economic activity.” Economists have been on the wrong side of the trade balance figures for 30 years. The trade deficit has expanded all the while that stocks have risen. It declined significantly only from 1987 through 1990, when stocks were in a Primary-degree bear market that eventually produced a recession. As stocks were soaring and the economy was expanding from 1982 to 1987 and again from 1990 to 2000 and then 2002 to the present, the annual trade deficit grew and grew. This is a fact. What economists have on their side is lots of logic. When do facts contradict logic? When one’s premises are wrong. The premise that an expanding trade deficit is bad for the economy has been wrong for at least a third of a century. As the trade deficit was rising, economists should have been recognizing it as a sign of high consumer optimism and retail activity in the U.S. The irony stemming from economists’ improper premise will continue in the bear market. When the trade deficit begins shrinking again, economists will assign it a bullish value when in fact this time it will go hand in hand with the onset of a depression.
The Elliott Wave Principle of Human Social Behavior
Trade Figures
As for the economy, the recessions of 1980 and 1982 followed a narrowing trade deficit. The next time the deficit began to narrow, in late 1987, it again led three years later to a recession, as the deficit shrank all the while. Those who followed the observations of economists and expanded their businesses in 1979 or 1989 on economists’ predictions that the newly shrinking trade deficit was bullish got caught in both recessions.
In both cases, when the trade deficit began expanding again, so did the economy. Yet in 1994, the federal government, spurred on by economists, became apoplectic over the persistent trade gap and even risked a trade war over it. If the administration had somehow managed to force a further reduction in the trade gap, it would have derailed the economic recovery that came with its renewed expansion, reaping the opposite results that economists promised.
Today this erroneous theme remains alive and well. The Associated Press recently told us, “The Asian currency crisis hit America full force in March, pushing the month’s trade deficit to a record.” What is the implication? “Analysts predict this year’s overall deficit will easily be the worst in history,” “worst” implying that it is a bad thing for the economy, despite 24 years of the reverse correlation. An economics writer for The Atlanta Journal-Constitution tells us, “The soaring trade deficit presents clear evidence that Asia’s mess is starting to lap onto U.S. shores.” At any time the deficit was soaring during the preceding 24 years of a generally rising trend, did it present “clear evidence” of an Asian mess? No, because Asia was not in a mess; it was booming. The supposed connection to any crisis in Asia does not exist. As I write this paragraph, the figures for August have just been released. Concomitant with the new all-time high in stocks in July and the continued economic expansion, trade figures hit an all-time record deficit, showing that the trends remain in lock step. Needless to say, the chief economist at a “Washington think tank” says, “We have a lot of bad months ahead of us on trade...it wouldn’t take a lot to push us into a recession.” If his forecast is for “bad months,” i.e., higher deficits, then he should not be predicting a recession. If he expects a recession, then he should forecast a narrowing trade deficit. At least the writer of the AJC article admits this much: “It’s hard to comprehend the story because the facts are so jumbled.” The facts are not jumbled. It is the thinking that is jumbled because the wrong premise is unceasingly at war with the facts. The correct premise is that when the U.S. economy is strong, its citizens buy more goods from abroad, while citizens of other countries, most of which have a higher savings rate, save a portion of the money they receive rather than spend it. The trade balance does not cause economic trends; it results from them. This situation may change, but that is how it has transpired for at least the past few decades.
A further irony of conventional assertion, after two dozen years of wrong-headed consternation over the rising trade deficit, is that when the U.S. economy contracts again (as it surely will), these same writers and analysts will be saying, “See, we told you that the big deficit was bad! Look what finally happened.” Those of us watching the graph, however, will probably be observing a shrinking deficit along with the next contraction. We can further assume, until the relationship changes, that as the economy continues to shrink, the trade deficit will continue to shrink right along with it. Conventional analysts, meanwhile, will be saying that the new trend is bullish. Those who believe it will get caught in the developing economic downdraft for the same reason they were too cautious all the way up: a belief that the relationship of the trade balance to economic health is the opposite of what it actually is, both in causality and implication.
That the purported relationship between such data and the trend of the stock market does not exist is invaluable knowledge for avoiding losses and for allowing the implementation of effective investment strategy, not only for the long term but also for the short term. For example, Dave Allman on the Elliott Wave Short-Term Update on May 16, 1988, the night before a monthly trade figure was to be reported, ignored the fact that an announcement was due and listed three Elliott-wave calculations indicating a short term high “within five points of Dow 2025” and added, “the [short- term] cycle high we’ve been tracking is due now.” The trade figure reported before the next morning’s opening was, according to one televised economist, “unbelievably good.” The high Dow print that morning was 2023, as trade-report watchers bought stocks on the “good news” of a lower figure while those who had bought the previous day celebrated because they had “guessed right.” The rally ended in thirty minutes. In the next two days, the Dow plummeted 100 points to a new low for the month. The point is not who was right on the market in this instance but who was wasting his time and who had his eyes on what mattered. The “key numbers” watchers had their eyes on the magician’s flashy assistant instead of the magician himself, and they got fooled.
Although news followers pay the price for being lazy, they aren’t short of explanations when the market moves contrary to the presumably logical way. They simply invent a new premise! When the market underwent the mysterious drop described above, some after-the-fact explanation was necessary. (Had it gone up, the explanation would be obvious.) They therefore offered the idea that the report of a narrower trade deficit may have generated “inflation fears,” which caused the market to drop. By logical extension, shouldn’t big deficits have stirred deflation fears from mid-1982 through mid-1987, when the trade deficit rose persistently? Yet that was a period during which the money supply soared 170%. Also, why was the U.S. dollar rallying if the market had inflation fears? Like the supposed bearish indication of a growing trade deficit, this new explanation was all rationalization, sans evidence or integration.
The multitude who stay up nights trying to guess these various figures and explain their meaning haven’t done any correlative research. They have countless theories but no data. In contrast to such varying obsessions, a socionomist focuses primarily on the patterns and psychology of the market, not on the background. |

