Additional References
June 2006, EWFF
Guess what? Stock-linked bank accounts are back. The New York Stock Exchange reports “an increase in the sale of market-indexed CDs and is concerned that some customers don’t understand the difference between these hybrid products and traditional CDs.” We are not surprised. In this day and age, many economists don’t understand the difference, either. That’s why they continue to argue for a change in the traditional definition that would consider gains in stock portfolios as savings. This mentality is a result of the long bull market in social mood. Near the end of such periods, thoughts of loss are banished from the realm of the possible. A related capitulation to the social mood is an FDIC decision to raise to $250,000 the ceiling on the insured level of some bank accounts. If government regulators believe that the risk of loss is so remote that it’s safe to increase the maximum coverage, then it must be time for a bank-shaking bear market.
December 2005, EWFF
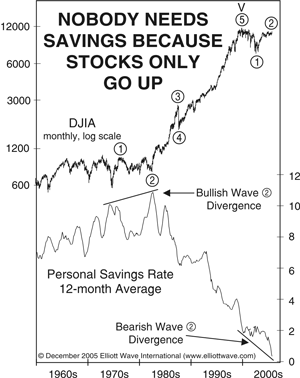
Who Needs savings?
One of the most impressive pictures of the epic public faith in the rising trend is this chart of personal savings rates over the last 40 years, which depicts a rising sense of fearlessness. The source of this emotion is clearly the bull market. The savings rate peaked in August 1982, the exact month of the low in stocks, and plunged with every major advance of the bull market. In 1999, when the monthly savings rate (as it was then devised) fell below zero for the first time, here’s what EWFF had to say about it:
The draining of bank accounts right before final highs is a time-honored tradition. Dramatic peaks in consumers’ willingness to bet on the future instead of conserve for it have been forerunners to almost every important stock market high since 1970. We have no doubt that the ratio will re-enter the more normal realm and create a colossal version of the more earthbound peaks of 1972, 1976, 1983, 1987 and 1990.
EWFF’s forecast of a rise back toward positive territory for the savings rate happened immediately. U.S. statisticians simultaneously re-configured the definition of savings so the rate would not go negative. Adding money market instruments to the savings total, the government “adjusted” the rate back to a positive level. As Elliott Wave International has pointed out with respect to several of these recalibrations, such as Dow Jones’ decision to reconfigure the DJIA to include high-flying technology companies in late 1999, these changes are themselves signs of trend extremity. The initial move below zero and its recalculation did, in fact, correspond to a market peak and a rise in the savings rate from 1.85% in March 2000, the month of the all-time high in the S&P, to 2.23% in November 2002, one month after a market low (see chart above). The current plunge to historically low levels is evidence of wave 2’s extraordinary capacity for regenerating, in this case superceding, the psychology of the prior peak. Notice that the wave 2 decline that ended in August 1982 created a similar divergence in the opposite direction. At this point, savings are so widely shunned that even the U.S. government’s reconstituted monthly number is below zero.
Savings rates, then, have joined mutual fund cash levels, New York Stock Exchange seat prices and various measures of long-term bullish sentiment (such as the duration for Investors Intelligence’s record long bullish consensus) in achieving record levels. These extremes in the absence of any corresponding all-time highs in the three major stock indexes—the Dow, NASDAQ or S&P 500—are powerful evidence that the last three years of rising stock prices is a countertrend bear market rally that will be completely retraced.
According to one account, this “startling trend” means people are spending more than 100% of their after-tax income. Because of the average household’s stock and real estate holdings, many economists insist that the lack of savings is not a problem. Consumers are “figuring that the unprecedented increase in property values will bail them out of the financial shortfall. ‘It’s human nature,’” says a Federal Reserve Board economist. That’s certainly true, but it is completely unprecedented, and, it comes precisely at the point in the wave pattern when humans can be counted on to try to re-experience the glory of a prior peak. In normal times, people keep savings on hand because they realize that stocks and real estate are uncertain stores of value.
Several stories contend that this is the first savings rate deficit since the Great Depression, but this is probably untrue. Discretionary income for the 1920s and 1930s is unavailable, but savings and income data from the U.S. Census Bureau show that the savings rate surely rose from 1929 to 1932. According to the data, savings fell 15% but the savings rate had to rise because income fell much harder, at 55%. Financial assets are now considered synonymous with “money in the bank.” This rare belief is rock-solid evidence that the unfolding peak is a 200-year event that almost no one is prepared for. When people are scared, they find ways to scrimp and save. At this point, they are anything but scared; in fact, the savings rate says they are as bold as they have ever been. |