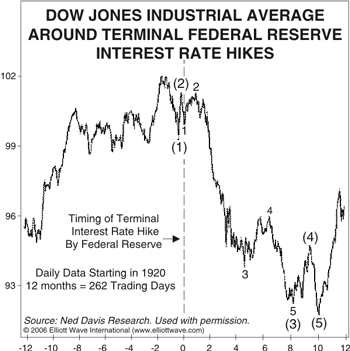
Next week as the excitement over the Federal Reserve Board’s likely decision to halt rate hike plays out, keep in mind this chart from the April issue of The Elliott Wave Financial Forecast. As we explained in April, the Fed typically stops raising rates “after the market it finished going up.” The chart from Ned Davis Research is a composite of what happened the last 16 times the Fed stopped tightening since 1920. Another Comstock Partners investigation into the last 12 tightening phases over 53 years finds that the S&P 500 fell 10 times after the final rate increase by an average of 22%. On average the market bottom occurred 10 months after the end of the tightening. “Importantly, an economic recession followed in 9 of the last 12 cases,” adds Comstock. “On average the economy did not peak until 4 months after the last rate increase, although in two instances the peak actually occurred first, meaning that the last tightening was implemented after the recession started, but before the Fed was even aware of it.”
This may be the case now as the employment report and other signs of slowing are evident if you know where to look. This morning investors’ cheered a disappointing employment number with a burst of buying. The tone should change drastically as the economic forces discussed here on July 28 come into full view. If our forecast is accurate, the decision not to raise should turn out to be more than a momentary "pause" that many expect. It should be the end of the tightening. Coming three months after the stock market peak, it's right in line with the chart EWFF showed back in April. |