 Steroid Testing Up, Home Runs Down Steroid Testing Up, Home Runs Down
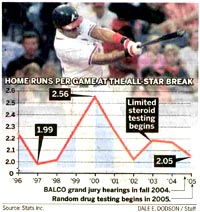
As Major League Baseball takes its annual breather for tonight's All-Star game, 2,685 homers have been hit thus far, a drop-off of nearly 5 percent from last year. Barry Bonds' knee still hurts. But baseball is looking at a possible eight-year low in home run production. This comes with the game in its first season of random drug testing, a confluence of events that is hardly coincidental to some.
The Atlanta Journal-Constitution, July 12, 2005 |
| April 2007 |
| S |
M |
T |
W |
T |
F |
S |
|
1
|
2
|
3
|
4
|
5
|
6
|
7
|
|
8
|
9
|
10
|
11
|
12
|
13
|
14
|
|
15
|
16
|
17
|
18
|
19
|
20
|
21
|
|
22
|
23
|
24
|
25
|
26
|
27
|
28
|
|
29
|
30
|
|
|
|
|
|
|
|
 |
|
« Previous |
Main Page
| Next »
|
Big League Bats in Power Slump
By: Pete Kendall, July 13, 2005 |
"Sluggers will tire and stop hitting home runs."
The Elliott Wave Financial Forecast, September 1999 |
Following The Elliott Wave Financial Forecast's September 1999 forecast, home run totals rose to one more new high, and they have been down since. The full entry from September 1999 and several recent EWFF entires (see additional references below) tell the story. Count us among those who consider the "confluence" of home-run reducing forces "hardly coincidental."
The graphic above from the front page of the July 12 Atlanta Journal-Constitution shows how beautifully home runs per game have tracked the stock averages, spiking to an all-time high with the peak in stocks in 2000 then declining into a low in 2002. After rising in 2003, an up year, and hovering at about the same level in 2004, a mostly sideways year, the total is falling again in 2005. Is there a larger message to this renewed "slump?" We think so. Home run totals have a long history of tracking the stock averages. To view a chart that shows a detailed look at home runs per game all the way back to 1901 click here. The chart reflects a strong correlation between stocks and homers, not to mention the basic five wave form EWFF used to predict the home run reversal in 1999. Notice that the first major rise came in the 1920s as stocks boomed and ended in 1930, the start of the Great Depression. A retrenchment ended in 1943, right after the start of Cycle III in the Dow. Starting four years early, in 1961, and ending, a little after the major Dow low of 1974, the fourth wave correction in HR output is little longer than Cycle IV. But with a second wave low in 1981, a third wave burst above 2.0 home runs per game for the first time in 1987 and a fifth wave rise from 1.4 hr/game to 2.34 in a fifth of a fifth wave from 1992 to 2000, the trend over the last 30 years is very much in line with Cycle V in stocks, as well as the initial phase of the bear market.
Due to various overlaps, the wave form is not ideal, but this is somewhat understandable as Major League Baseball has consistently tinkered with the rules of the game. These changes range from more tightly wound baseballs (1920s and 1990s) to a lowering of the pitching mound (1968), allowing designated hitters to bat for pitchers (1973), a shrinking of the strike zone and the construction of new ballparks in shapes and places that are more susceptible to the long ball (the 1990s). These structural changes probably account for the distortion in the wave count, as they can create some wild year-to-year swings. On a longer term basis, however, they fit right in as they all promote the production of home runs and thus conform to the long-term trend of rising stock prices. As one educational website, Riverdeep.net, explains, "Fans like the excitement of homers — the more homers are hit, the more tickets are sold."
With the institution of random drug test, however, baseball has moved away from the long ball for the first time. Why, when it will cost the game home runs, excitement, fans and ticket sales, is baseball cracking down on steroids? The answer is simple. It’s a bear market. |
|
|
Additional References
EWFF, September 1999
Evidence of a Grand Supercycle Peak
Another "Home-Run" Year
For the first time since 1986 and 1987, the two seasons leading to the 1987 crash, the record for the total number of homers (5,064 last year) is likely to fall in consecutive years. home runs are running 11.1% ahead of last year's pace. On top of that, Mark McGwire and Sammy Sosa are replaying last year's home run race. "The homer has become commonplace," laments Bob Costas. The other day, when people barely even noticed that McGwire had "set yet another incredible" record by hitting his 50th homer for a fourth straight year, the papers even came up with a name for it, "chronic milestone fatigue. "Too many baseball records are falling in too short a period of time to keep the national interest." This is another cultural manifestation of the diverging social mood covered in the Cultural Trends section of the April EWT. This divergence actually extends back to the early 1990s, when we called for a reversal in baseball's attendance based on a five-wave, century-long pattern in attendance figures. On a per game basis, the highs of 1993 have not been exceeded.
 The graphic from USA Today's cover story on the fans' "ho-hum" reaction to the greatest home-run display in history suggests that performance will eventually catch up to the slowly developing bear market in fan interest. It shows that measured in 10-year spans, the bull market in home runs has traced out a five-wave pattern of its own. The fact that the multiple from high to low is 2.618 strengthens the case for a peak this decade. As we have said before, in the cultural realm, the completion of a five waves leads to changes in style and performance simply because "it's time." Sluggers will tire and stop hitting home runs. In May, EWT noted that the greatest athletes seem to have internal clocks that reflect mass changes in social mood to an almost uncanny degree. The graphic from USA Today's cover story on the fans' "ho-hum" reaction to the greatest home-run display in history suggests that performance will eventually catch up to the slowly developing bear market in fan interest. It shows that measured in 10-year spans, the bull market in home runs has traced out a five-wave pattern of its own. The fact that the multiple from high to low is 2.618 strengthens the case for a peak this decade. As we have said before, in the cultural realm, the completion of a five waves leads to changes in style and performance simply because "it's time." Sluggers will tire and stop hitting home runs. In May, EWT noted that the greatest athletes seem to have internal clocks that reflect mass changes in social mood to an almost uncanny degree.
January 2005
Squeezing the Juice Out of the Long Ball
What's the difference between the steroids' controversy in baseball and the accounting crisis at Fannie Mae? From a socionomics perspective, there is none. The slackening of accounting rules that allowed corporations to pump up their financial statements and the use of performance-enhancing substances by professional baseball players are just separate mediums through which the peak mood of the 1990s and early 2000s "juiced up" the social environment to reflect the end of a 200-year bull market. One key attribute of a fifth wave is that it lacks the underlying strength of the preceding third wave. But what fifth waves fail to produce in substance they make up for in an abundant optimism. Apparently, when it is a fifth wave of Supercycle degree, the positive outlook is so rigorously imposed on society that long-established social institutions such as professional baseball or industries such as the mortgage field stretch conventional standards to allow the achievement of record-high results, or at least the impression of them. As The Elliott Wave Theorist explained with regard to the financial fundamentals in September 1998, one key attribute of the last leg of the great bull market was its ability to get novice, as well as professional observers, to explain away, ignore and deny a long list of financial measures that were clearly weakening in the bull market's waning days (see Chapter 1 of Conquer the Crash).
A bear market is the path through which historical standards and values are re-established. The first phase of this movement focused on Enron, and the front edge of the next wave is being signaled by a series of events that Bloomberg magazine is calling "Fannie Mae's Fall From Grace." It is no coincidence that the steroids scandal in baseball also rose to the fore in December. Like many of Fannie Mae's accounting tricks, widespread steroid use by major league players has been an "open secret" for some time. It is generally thought to date back to the front-end of the bubble era. Observers say they first noticed a suspicious bulge in homers and player physiques in 1995, the year the first bubble stocks appeared and the most manic phase of the long bull market began. In 1998, when the left shoulder of the great peak was formed by a preliminary high for most of the major averages, the Chicago Cubs Sammy Sosa and St. Louis Cardinals Mark McGwire both surpassed Roger Maris' single-season home run record in an epic bid for that season's home run crown. McGwire won with 70. In 2000, Major League Baseball set the all-time record for total home runs with 5,693, which marked an incredible 71% increase from 1990. In 2001, Barry Bonds broke McGwire's single-season record with 73 homers. In 2004, he crossed the 700 mark for his career and moved within striking distance of the most venerated record in sports, Hank Aaron's all-time home run record of 755. But his accomplishments, as well as the integrity of the game, were called into question earlier this month when it was revealed that Bonds had admitted to using steroids ("unknowingly"), during the 2002 season. The admission was a "scales falling from the eyes" moment for the game. Suddenly, the media had to face the fact that Major League Baseball looked the other way as Bonds and a host of other bulked-up stars effectively neutered the game's cherished record book. "Baseball's numbers are sacred. So now, if you can't believe the numbers, what's left to believe in?" asks one scribe.
In the same vein as stock "bears" who nevertheless call for a continued market rise in 2005 and those recognizing real estate as a bubble yet call for real estate to remain buoyant, many sports columnists are incensed by the steroid revelations, but say there will be little or no effect on the game in 2005. They continue to track a high level of indifference on the part of fans. At this year's winter meetings, player salaries again notched higher, and teams report no discernible effect on season ticket sales. "Fans Don't Care About Steroids," says one headline. What these writers do not understand is that the overriding force behind baseball's popularity was the long bull market, and the current indifference is the result of a countertrend rally that is ending. As its influence fades and the bear market returns, the baseball crowds will thin out and the disgust will come pouring out. The effects of a deepening negative social mood will undoubtedly extend onto the field since most players took steroids for the same reasons investors bought stocks: to make money, to mimic one another and, as author Carl Elliott explains, to avoid "the risk of being left behind." "This may be less about the desire to succeed than the desire to avoid shame and humiliation," says Elliott. The fear of shame and humiliation is a powerful motivator. But it totally re-orients itself in a bear market. As steroids and other performance-enhancing drugs themselves become a source of shame, not to mention severe punishment, their use will wane. This will probably reduce the size of the players (as forecast in the April 2001 issue of EWT) and home run counts, but it will get the game more in line with its roots, which is what bear markets are all about.
July 2005
It's somewhat incongruous to see the horror movies rise to the level of full-fledged industry while many bull market institutions and icons press on to new highs. The bull market sports of baseball and basketball, for instance, are holding up relatively well. Basketball enjoyed a slight uptick in regular season attendance this year, to a new record high, while 2004 brought out a record number of baseball fans, also by a slight margin. But the bear market dike appears ready to burst. League-wide scoring droughts, failures by teams that dominated through the course of the old bull market and player/fan altercations have marred both sports. For basketball, the potential for a stunning reversal is evident in 2005 apparel sales. After rising 30% in each of the last three years, NBA licensed jerseys, T-shirts and jackets fell by a third so far this year, according to SportScan. TV ratings for the NBA finals were down as much as 35% from 2004 levels. "Someone has abducted the fans who used to watch the NBA finals," reports The New York Times. In baseball, the steroids controversy finally moved to page 1 with the March peak in the major averages. As it has, the game's greatest player, Barry Bonds, has gone to the bench, his assault on the all-time home run record sidetracked by injury and steroid allegations.
Given their troubles, it's amazing that baseball and basketball still have fans. But there's a simple socionomics explanation: the Value Line Arithmetic index hit a new all-time high June 17, just as it did in May 1968. This lift in the small-cap stocks was strong enough to produce an uptick in the fortunes of these games, which historically have been extremely sensitive to a rise in social mood. |
|
Post a comment
|
|
|
|
| RECENT ARTICLES |
|
April 16, 2007
Does Imus Cancellation Radio a Bear Market Signal?
read more |
April 12, 2007
One Small Coffee Shop Uprising for Starbucks, a Grande Leap for Labor
read more |
April 11, 2007
Dazzling Finish: Cars Bring Once-Boring Shades To Life
read more |
April 10, 2007
T in T-Line Stands for Top
read more |
April 5, 2007
The Fight for a Free Vermont? Must be a Big, Big Turn
read more |
|
|
| ARTICLE COMMENTS |
|
|
|
|
|